[cs_content][cs_element_section _id=”1″ ][/cs_element_section][cs_element_section _id=”2″ ][cs_element_layout_row _id=”3″ ][cs_element_layout_column _id=”4″ ][cs_element_headline _id=”5″ ][cs_element_text _id=”6″ ][/cs_element_layout_column][/cs_element_layout_row][cs_element_layout_row _id=”7″ ][cs_element_layout_column _id=”8″ ][cs_element_headline _id=”9″ ][cs_element_text _id=”10″ ][cs_element_headline _id=”11″ ][cs_element_text _id=”12″ ][cs_element_headline _id=”13″ ][cs_element_text _id=”14″ ][cs_element_headline _id=”15″ ][cs_element_text _id=”16″ ][cs_element_headline _id=”17″ ][cs_element_text _id=”18″ ][cs_element_image _id=”19″ ][cs_element_text _id=”20″ ][/cs_element_layout_column][/cs_element_layout_row][cs_element_layout_row _id=”21″ ][cs_element_layout_column _id=”22″ ][cs_element_headline _id=”23″ ][/cs_element_layout_column][/cs_element_layout_row][cs_element_layout_row _id=”24″ ][cs_element_layout_column _id=”25″ ][cs_element_text _id=”26″ ][x_image type=”none” src=”https://econitive.com/wp-content/uploads/2020/04/Untitled-drawing-3.png” alt=”” link=”false” href=”#” title=”” target=”” info=”none” info_place=”top” info_trigger=”hover” info_content=””][cs_element_text _id=”28″ ][x_image type=”none” src=”https://econitive.com/wp-content/uploads/2020/05/Annual-Cash-Flows-years-0-through-5-1.png” alt=”” link=”false” href=”#” title=”” target=”” info=”none” info_place=”top” info_trigger=”hover” info_content=””][cs_element_text _id=”30″ ][/cs_element_layout_column][/cs_element_layout_row][cs_element_layout_row _id=”31″ ][cs_element_layout_column _id=”32″ ][cs_element_headline _id=”33″ ][cs_element_text _id=”34″ ][cs_element_headline _id=”35″ ][cs_element_text _id=”36″ ][cs_element_headline _id=”37″ ][cs_element_text _id=”38″ ][cs_element_headline _id=”39″ ][cs_element_text _id=”40″ ][/cs_element_layout_column][/cs_element_layout_row][/cs_element_section][/cs_content][cs_content_seo]knowledge base → analyticalsCash Flow Estimation
For valuation purposes, the most important piece of financial information is without any contest Cash Flows. When we want to determine the viability of an investment opportunity, we need to understand how this investment will affect the company’s cash flows in the future. In this post, we focus on how we can estimate cash flows from financial statements.
We cover:
Cash flow identification
Pro forma statements
Alternative calculations of operating cash flows
The Cash Flow Identity
By cash flow, we mean the difference between the actual number of dollars, that came in (“cash inflow”) and the number of dollars that went out (“cash outflow”) in a given period. It sounds simple enough, but we have to be a little bit careful because a financial statement does not include this information directly.
The first step is to separate the cash flow impacts that stem from investment activities from the cash flows that stem from financing activities. Since we are talking about an actual cash flow stream, it follows that there must be a balance between what is invested, earned and spent on the investment side, and what is raised and distributed on the financing side.
We aggregate the investment side under the header “Cash flow from Assets”. By this, we include the investment outlay, necessary changes in the balance between short-term assets and liabilities, as well as operational cash flow impacts. It is in a sense, the Cash flow from Assets that drives the cash flow estimation.
Since the company can finance the investment with a mix of cash on hand, debt, new stock capital, etc. every investment must satisfy the simple cash flow identity:
Cash flow from Assets = Cash Flow to Stockholders + Cash Flow to Creditors
We do not need this identity for our presentation of cash flow estimation, but it is important to understand form a valuation point of view.
The cash flows generated from Asset to Stockholders and Creditors drive the viability of an investment. This viability is ultimately a function of the estimated cash flows as well as the stockholders and creditors’ opportunity costs of financing the investment.
Sources of Cash Flows
Any investment decision that we can think of will affect the company’s cash flow from assets. We can conveniently divide these into three categories: Capital Spending, Net Working Capital, and Operating Cash Flows.
Capital Spending (“CAPEX”)
The (net) capital spending is the simplest one to understand. Most investment projects include large investments in fixed assets and in some cases the sale of fixed assets; e.g. when the investment project entails the replacement of exciting equipment. The difference between the money spent on fixed assets and the money received from the sale of fixed assets is the net capital spending.
Net Working Capital
Besides investments in fixed assets, most projects will also require investments in short-term assets such as cash holdings, inventory, etc. These assets are referred to as current assets because it can reasonably be believed that they will be replaced or circulated within the current accounting year.
Similarly, a project may require changes in the firm’s current liabilities. I.e. all forms of short-term debt, which must be repaid within the current accounting year.
The difference between current assets and current liabilities is called Net Working Capital (“NWC”) and measures the firm’s ability to honor its short-term obligations with highly liquid assets such as cash or cash equivalents.
The way that we account for changes in net working capital is two-sided. At first, we tally up the necessary changes in current assets and liabilities to get the project started. Next, calculate the change in net working capital at project start. Finally, we counter this change at the end of the project’s life, where the changes in current assets and liabilities are no longer necessary.
This practice of accounting for the change in NWC upfront and then accounting for the exact opposite change at project end may seem odd. Many practitioners do in fact ignore it. However, for valuation purposes, it is paramount that we do account for changes in NWC. We explain in a different post why a cash flow at the beginning of a project carries a much higher weight in our decision-making than a cash flow at the end of the project, and thus, ignoring changes in NWC can prove catastrophic when we try to determine the viability of an investment project.
Operating Cash Flows
The last source that we need to consider is the Operating Cash Flow (OCF). We find this by taking our revenues and subtracting our costs. We cannot include depreciation because this is a non-cash expense, and we cannot include interest payments since these are financing costs (i.e. they belong to the right-hand side of the cash flow identity above), but we must include taxes since these are indeed cash outflows.
So, how can we calculate the OCF from a financial statement? First, look at the high-level structure of the income statement here below:
Note: EBIT = “Earnings Before Interests and Taxes” and EBT = “Earnings Before Taxes”.
Since we want to exclude Depreciation and Interests, but include Revenues, Expenses, and Taxes, there are a couple of different ways we can accomplish this. The simplest one, which is often referred to as the definition of OCF is simply:
OCF = EBIT + Depreciation – Taxes
Note that if we add Depreciation to EBIT we simply get the difference between Revenues and Expenses. Add to this the company’s taxes, and we are done!
Pro Forma Financial Statements
To get an overview of the Operating Cash Flow impacts of an investment opportunity, we can organize all the relevant financial components in a Pro Forma Financial Statement. This is a table that is structured as a normal financial income statement, but only includes figures relevant to the actual investment opportunity.
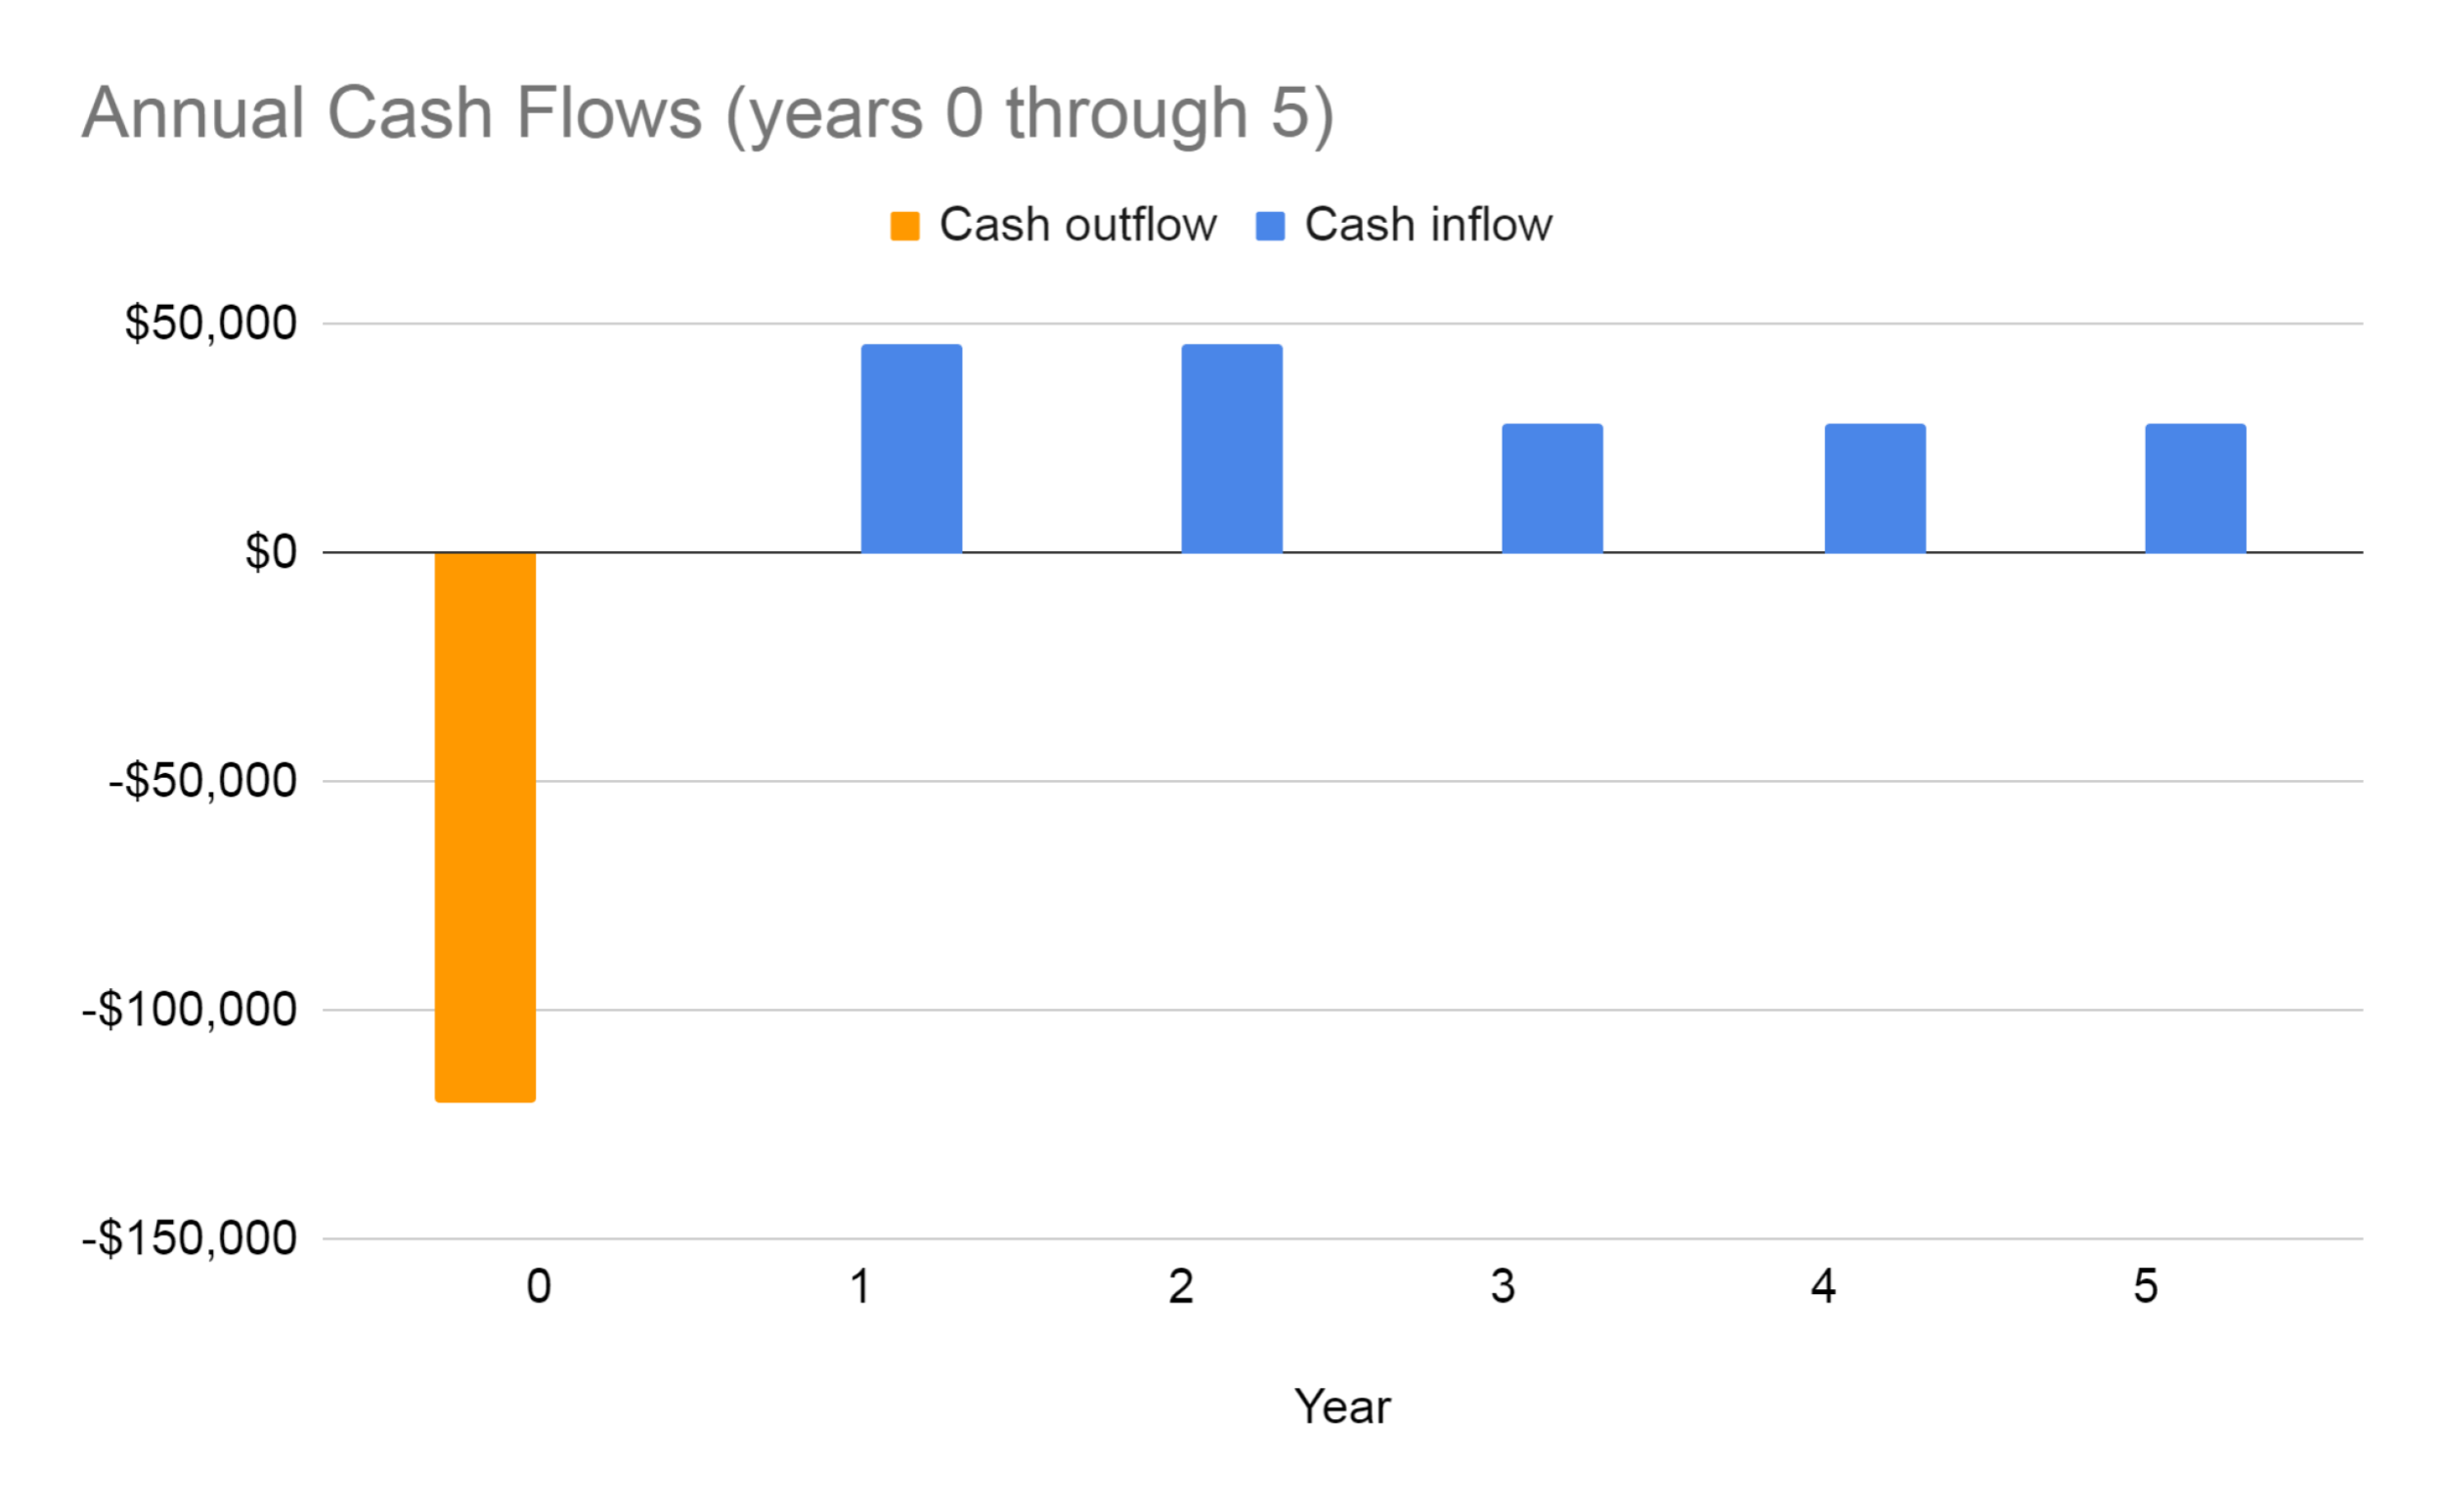
As an example, assume that we have an opportunity to invest $120,000 today in a piece of green energy-saving equipment that will produce annual cost savings of $30,000 for five years, and we write off the equipment straight line to zero over these five years. Furthermore, we expect to leverage this green investment to attract a new segment of energy-conscious customers. We expect that the additional revenues from this will be $25,000 per year for two years after which the effect will have worn off. We do not need to make changes to the net working capital. If our tax rate is 30%, how can we determine the relevant cash flows for this investment opportunity?
It is fairly simple to see that the Capital Spending (or CAPEX) is a $120,000 cash outflow today and that the change to NWC is zero throughout our planning horizon. The OCF however, requires a bit more thought.
In the table below, we have plugged in the additional revenues (two times $25,000) and the cost savings (five times $30,000). Since the $120,000 equipment cost is written off straight line to zero, the annual depreciation expense is $120,000/5 = $24,000. Based on these figures we calculate the annual EBIT. We note that potential additional interest expenses are ignored since these are financing expenses. Finally, we deduct taxes using the 30% rate.
In order to calculate the OCF, we use the definition: OCF = EBIT + Depreciation – Taxes for each year to identify the estimated cash flow stream for the next five years.
The figure above illustrates the relevant cash flows for the project throughout its five-year planning horizon.
Alternative OCF Calculations
It is clear from the example above that the calculations of operating cash flows could have been carried out in a number of alternative ways. In fact, three alternatives to the OCF calculation are very popular in practice. Each has its merits, and each will give us the correct estimates.
Bottom-up Approach
Since we are ignoring financing expenses such as interest payments, we see immediately that the Net Income is equal to EBIT – Taxes. This means that we can estimate the OCF by the sum of Net Income and Depreciation expenses directly. That is:
OCF = Net Income + Depreciation
Top-down Approach
Alternatively, we can replace EBIT in the OCF definition with
EBIT = Revenues – Costs – Depreciation
If we replace EBIT in the OCF definition with the right–hand side of this expression, we get:
OCF = (Revenues – Costs – Depreciation) + Depreciation – Taxes
Which reduces to
OCF = Revenues – Costs – Taxes
Tax Shield Approach
Finally, we can create an expression that directly involves the firm’s tax rate in the OCF calculation. If we start with the definition of OCF:
OCF = EBIT + Depreciation – Taxes
We note that EBIT is equal to EBT, which in turn means that Taxes = EBIT*TC, where TC is the corporate tax rate. This means that we can rewrite the expression above to:
OCF = EBIT * (1 – TC) + Depreciation
Then we note that EBIT = Revenues – Costs – Depreciation, and substitute this expression into the OCF:
OCF = (Revenues – Costs) * (1 – TC) + Depreciation * TC
This approach is very helpful when we are trying to grasp where the value of an investment project comes from. Some projects are valuable because of their operational contribution (i.e. Revenues – Costs), while others become valuable because of their depreciation tax shields.

 [/cs_content_seo]